
The average Redbridge home lost £13,153 in a year to July, the third monthly drop in a row. Last month's 3.6% rise has also been revised down to 2.5%.
The average home in Redbridge sold for £481,297 in July 2026. That is £13,153 less than a year earlier, a fall of 2.7%.
HM Land Registry published the July 2026 UK House Price Index on Wednesday 16 September.
A month ago we reported that Redbridge was the third-fastest riser in London. The new release changes that picture in two ways. July itself fell, and June has been revised down.
Three monthly falls in a row
Prices have now dropped month on month three times running, according to the index series for Redbridge:
| Month | Average price | Change on the month |
|---|---|---|
| April 2026 | £503,909 | +2.0% |
| May 2026 | £499,262 | -0.9% |
| June 2026 | £490,916 | -1.7% |
| July 2026 | £481,297 | -2.0% |
April is now the borough’s highest point on the index. July sits £22,612 below it.
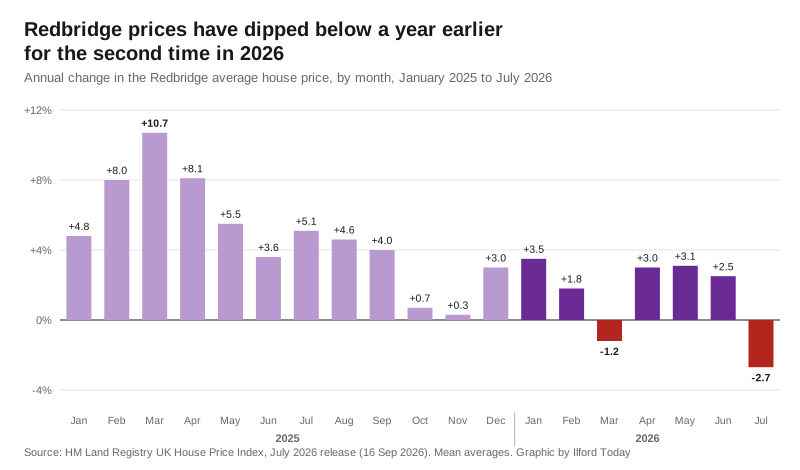
Part of the annual fall is about last year rather than this one. The Redbridge average jumped 3.2% in a single month in July 2025, to £494,450. That makes July 2025 a high bar to compare against.
June’s rise was smaller than first published
The first estimate for June was £495,977, up 3.6% on the year. The same month now reads £490,916, up 2.5%.
That is normal for this index. Recent months are restated as more sale records reach the Land Registry, and small areas move the most. The July figure will be revised too, so treat it as the least settled number in this article.
19th of 33 London boroughs
We ranked all 33 London boroughs on the year to July, using the same release. Twelve rose and 21 fell. Redbridge came 19th.
London as a whole fell 3.3% to £550,037. England rose 1.1% to £293,479. Redbridge is still doing slightly better than the capital. But three of its neighbours rose while it fell.
| Area | Average price, July 2026 | Change over the year |
|---|---|---|
| Barking and Dagenham | £375,604 | +5.3% |
| Waltham Forest | £529,102 | +2.8% |
| Havering | £448,648 | +2.1% |
| Epping Forest | £525,719 | -1.6% |
| Redbridge | £481,297 | -2.7% |
| London | £550,037 | -3.3% |
| Newham | £390,349 | -5.0% |
Barking and Dagenham tops the London table. The steepest falls were in the centre: Westminster down 20.7%, the City of London down 17.4% and Tower Hamlets down 14.4%.
Flats fell hardest
Every property type in Redbridge was cheaper than a year before:
- flats fell 5.2%, to £301,186
- detached houses fell 2.4%, to £1,095,799
- semi-detached houses fell 1.7%, to £681,463
- terraced houses fell 1.4%, to £534,863
Terraces held up best, as they led the rises last month. The first-time buyer average was £414,259, down 2.9%. Buyers paying cash averaged £438,072, down 3.1%, and buyers with a mortgage £490,456, down 2.6%.
What it means for you
If you are buying. Prices in the borough have been easing since April, not rising. A first-time buyer paid an average of £414,259 in July, 2.9% less than a year earlier. Expect this figure to be revised, as June’s was.
If you are selling. One month’s index does not price your home. The direction in Redbridge has been down for three months, and flats show the largest fall.
If you are staying put. On paper your home is worth a little less than a year ago. It is still well above where the borough stood in the first half of 2024, when the average sat between £451,476 and £462,070.
A note on the maths. UKHPI averages are means, not medians, so a few large sales pull them upward. For the middle sale price in Ilford, Wanstead, Woodford Green, Barkingside and Hainault, see our Ilford house prices page, which is built from individual Land Registry sale records. New homes in the pipeline are tracked on our Ilford planning news page.
Sources
- UK House Price Index for July 2026, HM Land Registry, published 16 September 2026
- UK House Price Index: Redbridge, HM Land Registry, monthly series January 2024 to July 2026
- UK HPI linked data for each London borough, HM Land Registry, used for the borough ranking
Have your say